Skip to content
Data & BICurriculum updated Sep 2026

TTFA Academy · A fellowship for people at work

EDA with Python

For analyst working in Excel and SQLPython Data Analyst

Python for the analysis you already do: cleaning, exploring and charting data you would otherwise fight in Excel.

  • 12–16 weeksevenings and weekends
  • 3 modules26 topics
  • 6 toolson real data
  • Live onlinerecorded the same day
View curriculum

Who this is for

For analyst working in Excel and SQL.

You already do part of this job. The program closes the gap between where you are and being seen as a Python Data Analyst.

  • You are a analyst working in Excel and SQL and want the next role
  • You know your domain; Python is what you are missing
  • You can give evenings and weekends for the length of the program
  • You'd rather show working projects than a certificate

Probably not for you, yet

If you haven't worked in the domain at all, a counsellor will say so on the call and point you to a better starting program. If you want a certificate more than a portfolio, this isn't it.

What you'll build

Three projects you can show.

Each project is modelled on the mentors' production work and reviewed 1:1. Together they are your portfolio.

  • Project 1

    A Python project from real work

    Modelled on the mentor's production work, with the messy parts left in, reviewed 1:1.

  • Project 2

    A build you own end to end

    Brief, build, review: the way a manager would hand it to you, with the checks that stop it breaking next month.

  • Project 3

    A final project reviewed like production

    Published, documented and defended, with the notes a senior would give you.

Curriculum

Three modules, in the order the work happens.

12 to 16 weeks, depending on your pace. Each module ends with an assignment a mentor reviews.

  • Reviewed in Sep 2026: 2 topics added to match what the work now asks for.

3 modules · 26 topics · pick a module to see what it covers

Module 1 of 32 new

Python Foundations

Equip learners with strong Python and EDA foundations to analyze, clean, visualize, and prepare data for analytics and machine learning.

  • Python Basics

    Why Python for Data Analytics · Python syntax, keywords, and naming conventions · Comments, documentation strings, and indentation

  • Variables, Data Types & Operators

    Variables and memory concepts · Numeric, string, and boolean data types · Operators and type casting · Python input and output operations

  • Control Flow & Functions

    Conditional statements and loops · Built-in and user-defined functions · Function arguments (positional, default, keyword) · Lambda functions and functional programming concepts

  • Modules & Libraries

    Using Python modules and packages · Introduction to commonly used libraries

  • Core Data Structures

    Lists, tuples, sets, and dictionaries · Indexing, slicing, and list comprehensions · String operations and manipulation

  • File Handling & Exception Management

    Reading and writing files · Error and exception handling techniques · Working with regular expressions

  • Data Manipulation & Analysis

    Data grouping and aggregation · Sorting, filtering, and joining datasets · Handling missing values and outliers

  • pandas 3 EssentialsNew

    Copy-on-Write, and why chained assignment no longer works · The string data type

  • SQL from PythonNew

    Querying a database from a notebook · Loading query results into a DataFrame

  • Data Visualization & EDA Libraries

    Data visualization concepts · Using NumPy, Pandas, Matplotlib, and Seaborn for analysis and visualization

Tools

The tools you'll work in.

You use each one on the kind of data your mentors handle at work, not on a toy example.

  • Python
  • Pandas
  • NumPy
  • MAT
    Matplotlib
  • SEA
    Seaborn
  • Plotly

Python for analysis

Read, clean and reshape data in Python the way an analyst does, without a software-engineering detour.

Pandas and NumPy

DataFrames, joins, grouping and vectorised calculations on files you would otherwise fight in Excel.

Exploratory data analysis

Profile a dataset, find the gaps and outliers, and form the questions worth answering before any model.

Visualisation

Charts that answer a question, in Matplotlib, Seaborn and Plotly, from a quick look to a shareable figure.

Descriptive statistics

Distributions, central tendency and spread, read correctly and explained plainly.

Written and oral communication

Present a finding and its caveats so a manager can act on it.

And the skills around the tool

  • Critical Thinking
  • Abstract Thinking
  • Analytical Thinking
  • Problem-Solving Mindset
  • Business Acumen
  • Communication & Storytelling
  • Stakeholder Thinking
  • Curiosity & Question Framing
  • Attention to Detail (with big-picture balance)
  • Learning Agility

TTFA Academy is an independent training provider. It is not affiliated with, endorsed by or a partner of Microsoft, Salesforce or Alteryx. Microsoft, Power BI, Excel and Fabric are trademarks of the Microsoft group of companies. Tableau is a trademark of Salesforce, Inc. Alteryx is a trademark of Alteryx, Inc. Names are used only to identify the tools taught.

LMS EXPERIENCE

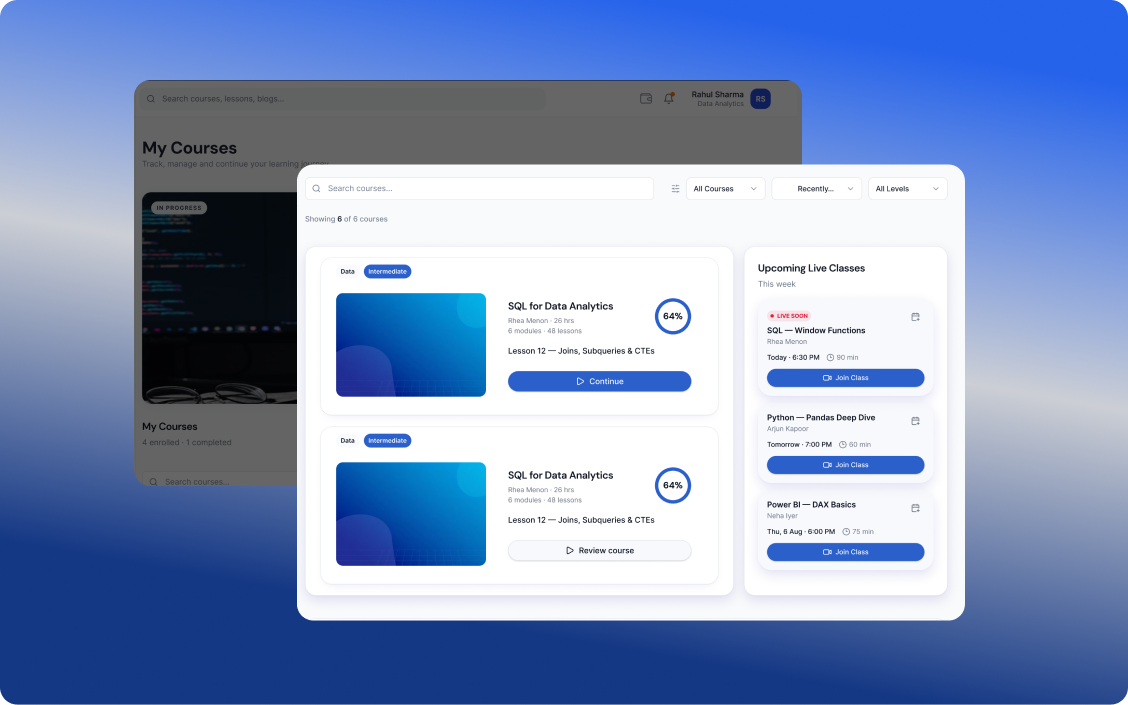
Your Complete Learning Journey, All in One Place

Learn at your pace, practice through real-world projects, build your skills, earn certifications, and discover opportunities that match your potential.

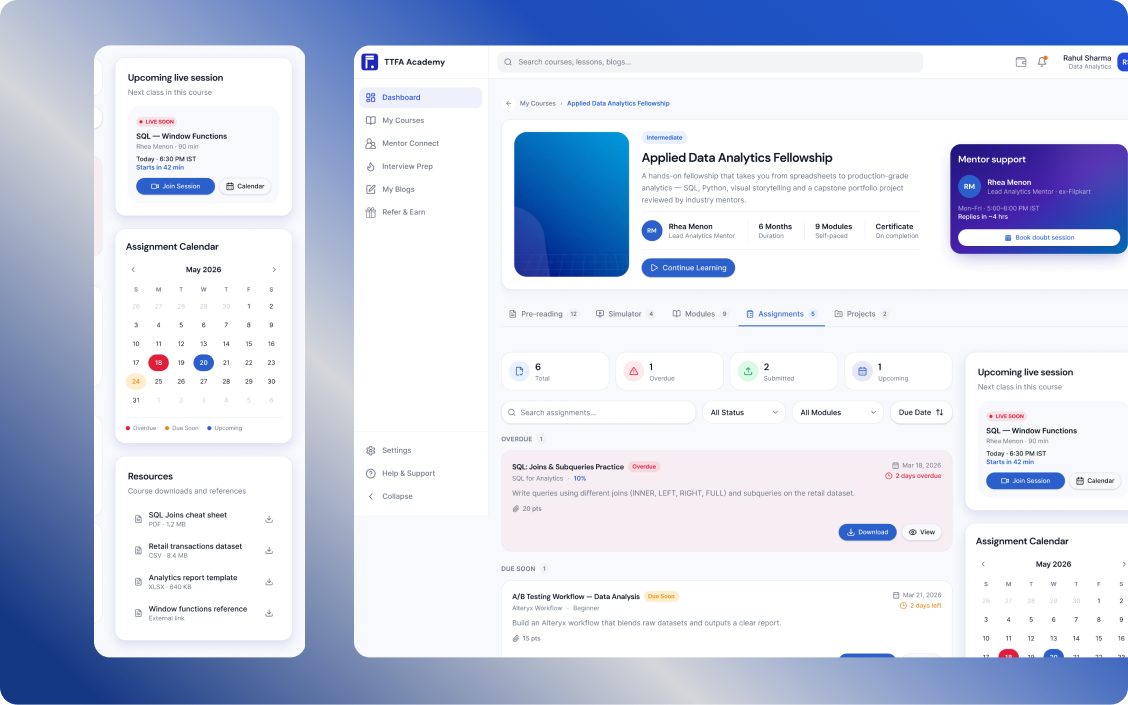
Learn and build skills
01

Learn & Build Skills

Complete industry-relevant courses designed to build practical skills and prepare you for real-world applications.

  • Hands-on learning
  • Practical Assignments & Projects
  • Industry Aligned Curriculum
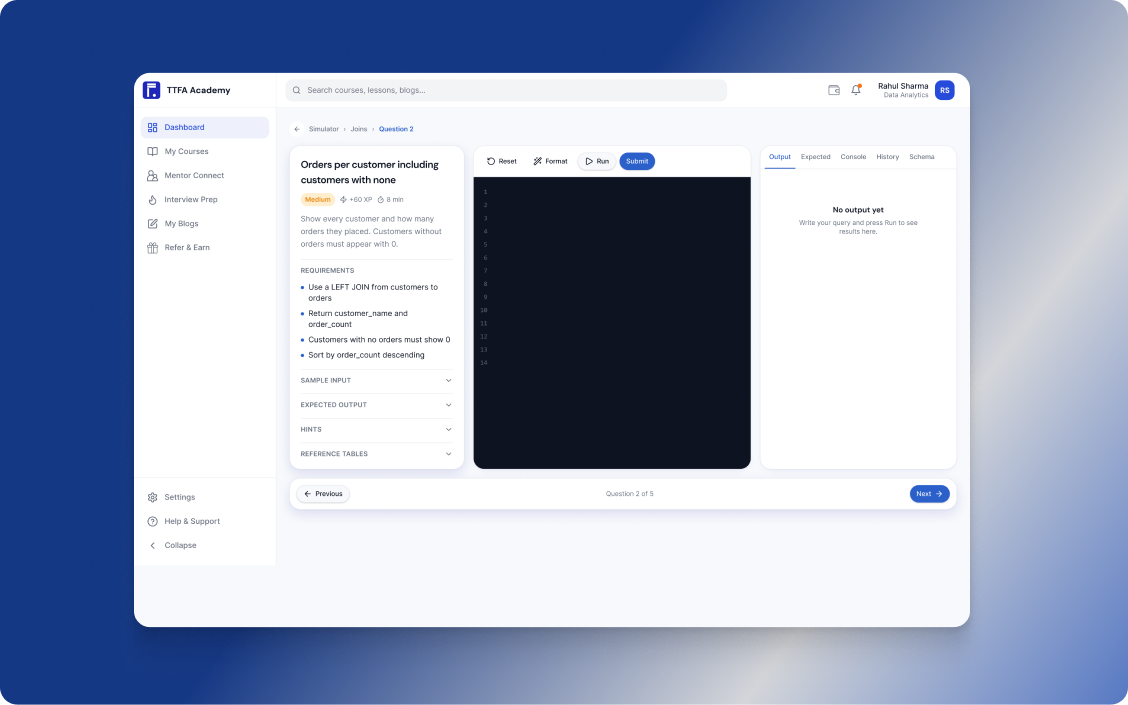
Learn through real projects
02

Learn Through Real Projects

Put your learning into practice with assignments and hands-on projects designed to build practical skills and help you grow with confidence.

  • Practical assignments to strengthen your skills
  • Real-world projects to apply what you learn
  • Build experience and grow your portfolio
Learn by doing
03

Learn by Doing

Practise real-world tasks with interactive simulators that help you apply your knowledge, sharpen your skills, and prepare for the workplace.

  • Real-world practice
  • Interactive simulations
  • Build skills with confidence
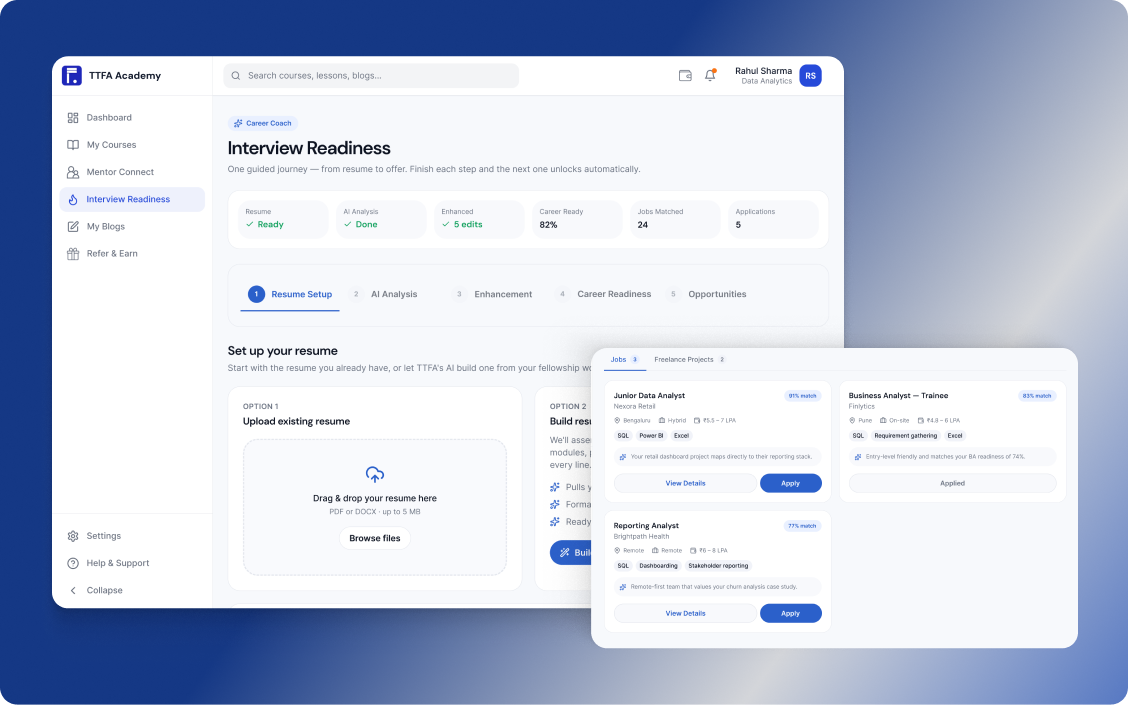
Discover your next opportunity
04

Discover Your Next Opportunity

Upload and enhance your resume, then discover job and freelance opportunities matched to your skills, experience, and career goals.

  • AI-powered resume enhancement
  • Personalized job & freelance recommendations
  • Apply to opportunities that match your profile
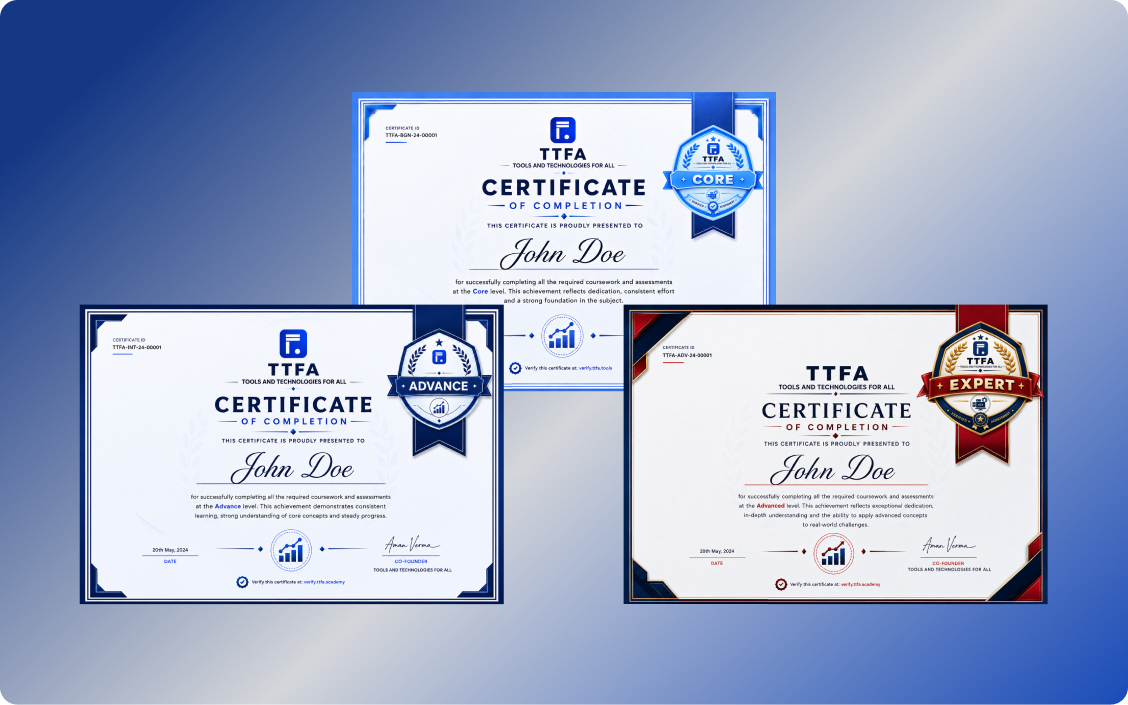
Earn certifications as you grow
05

Earn Certifications as You Grow

Complete projects, build your skills, and unlock certifications at each level as you progress through your learning journey.

  • Core
  • Advance
  • Expert

Your mentors

People who do this work in production.

Names, employers and photos appear only with their written permission.

How the weeks run

Built around a full-time job.

A counsellor confirms the exact days and times for your batch on the call.

  1. Weeknight live classes

    Two evenings a week with the mentor, on the work of the week.

  2. Weekend lab

    Project time with the mentor in the room: build, get stuck, get unstuck.

  3. Recordings and 1:1 slots

    Every class recorded the same day; 1:1 doubt-solving whenever you're stuck.

  4. Final project review

    Your projects reviewed like production work, with notes you can act on.

Questions

About this program.

Anything else: ask on the call.

Yes. The program assumes you know your work, not the tool. If you've never worked in the domain, a counsellor will point you to a better start.

Bring your current work to the call.

A counsellor looks at what you do today and tells you, straight, whether EDA with Python is the right next step.

Seamless Learning across every Device