Tell a counsellor what you do today and where you want to be seen. Fifteen minutes, no pitch.
Data & BICurriculum updated Sep 2026
TTFA Academy · A fellowship for people at work
Data analytics course for working professionals, live onlineApplied Data Analytics Fellowship
For MIS, ops or finance reporting in ExcelData Analyst
The long road: SQL, Tableau, Power BI, Alteryx and Python on live projects, for people who want the whole analyst job, not one tool. From MIS, ops or finance reporting in Excel to Data Analyst, taught by people who do the job.
Designed for AI-native analyst roles: the Generative AI for Analysts module teaches prompting for SQL, Copilot in Power BI and Tableau Agent, and how to check what they produce.
Applied Data Analytics Fellowship is a live online program for the MIS, ops or finance reporting in Excel: the next step is being seen as a data Analyst. The long road: SQL, Tableau, Power BI, Alteryx and Python on live projects, for people who want the whole analyst job, not one tool. Classes run over 24–36 weeks on weeknight evenings and weekends in IST and are recorded the same day, so a late shift doesn't cost you the week. You work in SQL, Tableau, Power BI, Alteryx and Python on projects modelled on the mentors' production work, each reviewed 1:1, with doubt-solving on the LMS between classes. A counsellor confirms the batch, the schedule and the fee on one call; nothing is charged on the call.
Why this program
Why people pick Applied Data Analytics Fellowship.
Results, your career, the part of the job you do by hand today, and who teaches it.
Results-focused
Dashboards a manager opens on Monday
By the end you have SQL you wrote, a Power BI and a Tableau build your team could use, an Alteryx workflow that runs on its own, and three projects to show.
Career-focused
From the MIS person to the data analyst
You already know the data. The fellowship adds what the analyst role asks for: SQL, Tableau, Power BI, Alteryx and Python, on work you can show in an interview.
Pain-point focused
The same cleanup, every week, by hand
The report you rebuild from exports can run itself. You learn the SQL, the prep and the refresh that make it happen, from people who run it at work.
Premium and professional
Taught by people who run this at work
Mentors who build this in production, projects modelled on their own, 1:1 review of every build, recordings the same day. For analysts who want to be taken seriously, not for anyone collecting certificates.
Who this is for
For MIS, ops or finance reporting in Excel.
You already do part of this job. The program closes the gap between where you are and being seen as a Data Analyst.
You are a MIS, ops or finance reporting in Excel and want the next role
You know your domain; SQL is what you are missing
You can give evenings and weekends for the length of the program
You'd rather show working projects than a certificate
Probably not for you, yet
If you haven't worked in the domain at all, a counsellor will say so on the call and point you to a better starting program. If you want a certificate more than a portfolio, this isn't it.
What you'll build
Three projects you can show.
Each project is modelled on the mentors' production work and reviewed 1:1. Together they are your portfolio.
Project 1
A SQL project from real work
Modelled on the mentor's production work, with the messy parts left in, reviewed 1:1.
Project 2
A build you own end to end
Brief, build, review: the way a manager would hand it to you, with the checks that stop it breaking next month.
Project 3
A final project reviewed like production
Published, documented and defended, with the notes a senior would give you.
Curriculum
Seventeen modules, in the order the work happens.
24 to 36 weeks, depending on your pace. Each module ends with an assignment a mentor reviews.
Reviewed in Sep 2026: 38 topics added to match what the work now asks for.
17 modules · 155 topics · pick a module to see what it covers
Module 1 of 17
SQL Foundations
Equip participants with the skills to manage, query, and analyze data efficiently using SQL tools and techniques.
SQL Introduction
Overview of SQL and Its Applications · Importance of SQL in Data Management
The exams are the vendors' own, taken separately; TTFA is not affiliated with them.
SQL
Learn to manage and query Structured Query Language (SQL) databases efficiently.
Descriptive Statistics
Understand data trends and measures for informed decision-making.
Visualization Tools
Build impactful dashboards using Tableau and Power BI.
Workflow Automation
Simplify complex processes with Alteryx.
Written and Oral Communication Skills
Enhance your ability to present and articulate data-driven insights.
Soft Skills Training
Improve teamwork, leadership, and professional etiquette.
And the skills around the tool
Critical Thinking
Abstract Thinking
Analytical Thinking
Problem-Solving Mindset
Business Acumen
Communication & Storytelling
Stakeholder Thinking
Curiosity & Question Framing
Attention to Detail (with big-picture balance)
Learning Agility
TTFA Academy is an independent training provider. It is not affiliated with, endorsed by or a partner of Microsoft, Salesforce or Alteryx. Microsoft, Power BI, Excel and Fabric are trademarks of the Microsoft group of companies. Tableau is a trademark of Salesforce, Inc. Alteryx is a trademark of Alteryx, Inc. Names are used only to identify the tools taught.
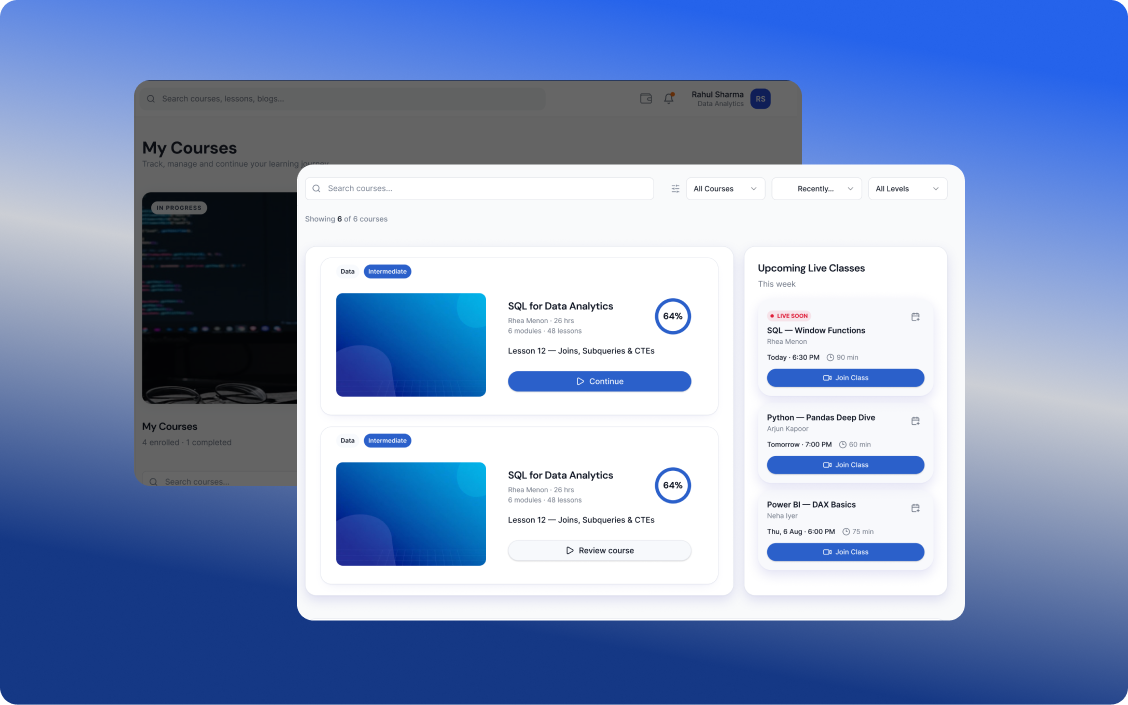
LMS EXPERIENCE
Your Complete Learning Journey, All in One Place
Learn at your pace, practice through real-world projects, build your skills, earn certifications, and discover opportunities that match your potential.
01
Learn & Build Skills
Complete industry-relevant courses designed to build practical skills and prepare you for real-world applications.
Hands-on learning
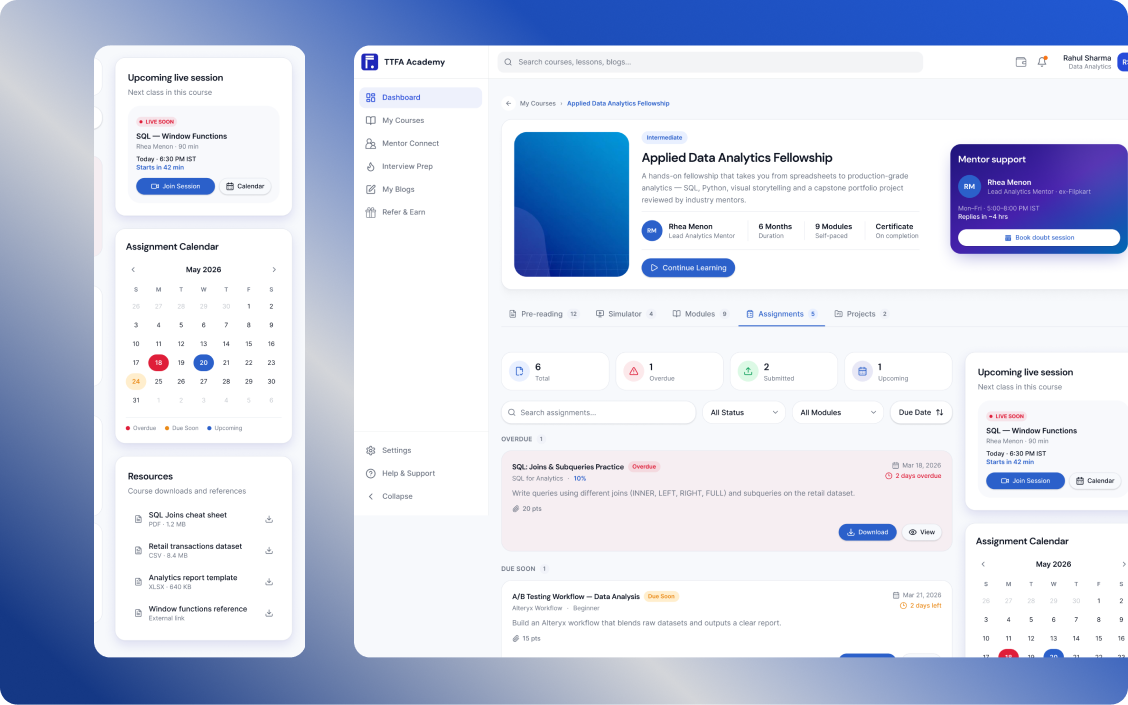
Practical Assignments & Projects
Industry Aligned Curriculum
02
Learn Through Real Projects
Put your learning into practice with assignments and hands-on projects designed to build practical skills and help you grow with confidence.
Practical assignments to strengthen your skills
Real-world projects to apply what you learn
Build experience and grow your portfolio
03
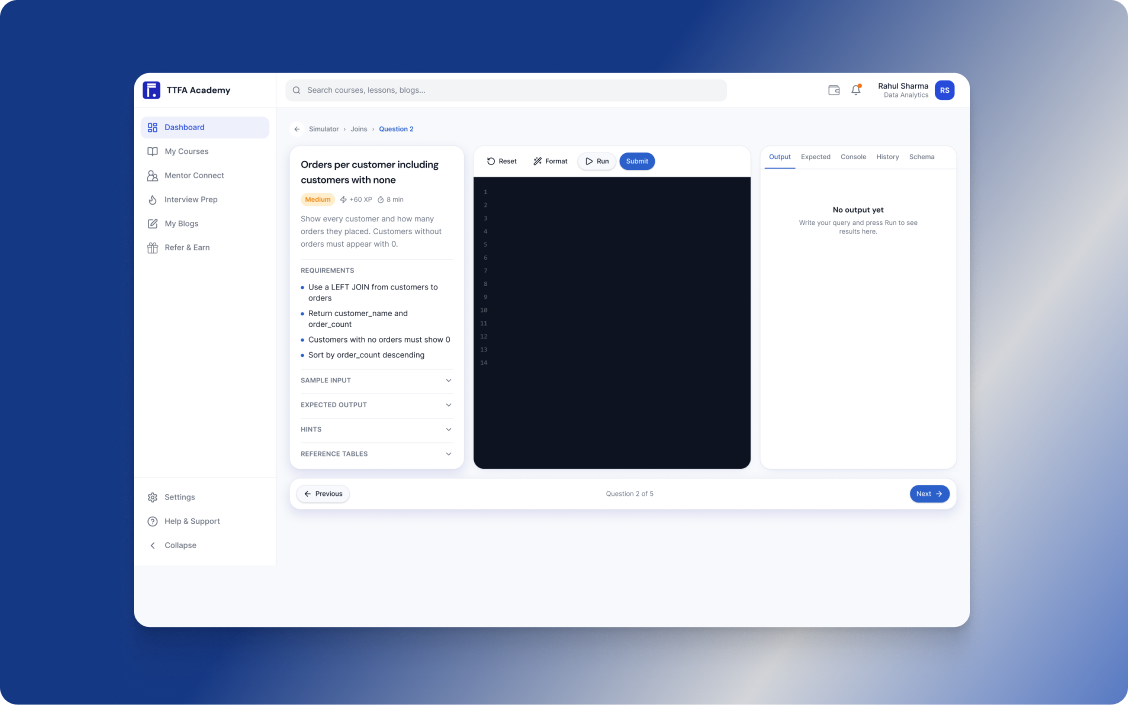
Learn by Doing
Practise real-world tasks with interactive simulators that help you apply your knowledge, sharpen your skills, and prepare for the workplace.
Real-world practice
Interactive simulations
Build skills with confidence
04
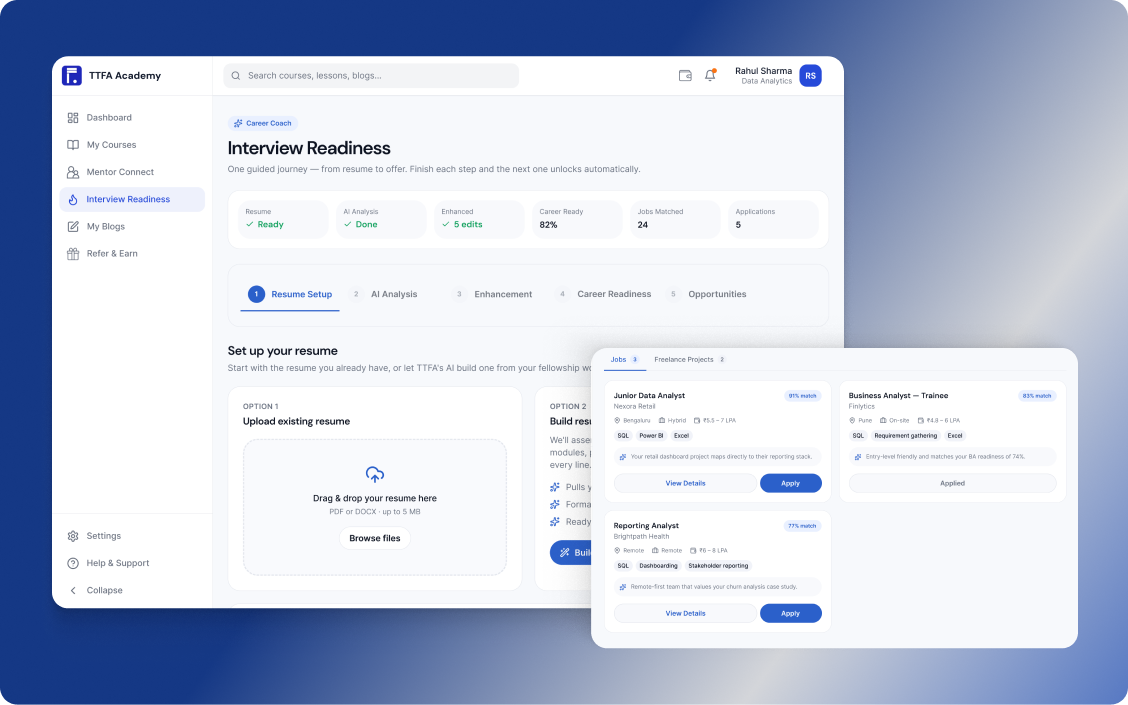
Discover Your Next Opportunity
Upload and enhance your resume, then discover job and freelance opportunities matched to your skills, experience, and career goals.
AI-powered resume enhancement
Personalized job & freelance recommendations
Apply to opportunities that match your profile
05
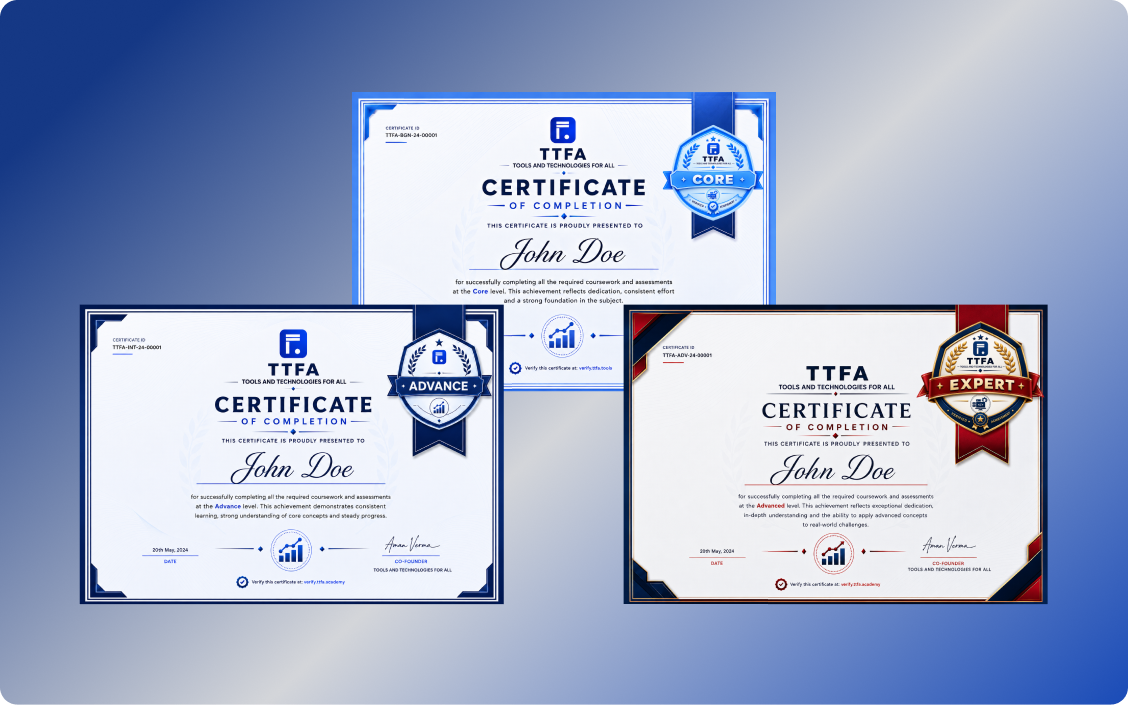
Earn Certifications as You Grow
Complete projects, build your skills, and unlock certifications at each level as you progress through your learning journey.
Core
Advance
Expert
Your mentors
People who do this work in production.
Names, employers and photos appear only with their written permission.
Jitendra Singh
Applied Data Analytics Fellowship
Jitendra Singh
Lead Instructor
Jitendra leads instruction at TTFA across the analytics stack: Alteryx workflows, Tableau and Power BI dashboards, SQL and Python on real company data, and the GenAI layer on top of them, from agents and MCP to RAG. He teaches the job the way it is done at work: real data, in the order you meet it, with the mistakes left in.
Applied Data Analytics Fellowship
Arvind Tiwary
Applied Data Analytics Fellowship
Arvind Tiwary
Senior analytics consultant
Arvind trains the analyst's working stack: Python and Alteryx for preparing and automating data, SQL for querying it, and Excel for the models and reports that run on it. He teaches the consultant's habits as well: scoping the work with the person who will use it, and handing it over so it survives without you.
Applied Data Analytics Fellowship
Sarvdeep Singh
Applied Data Analytics Fellowship
Sarvdeep Singh
Data & BI mentor
Sarvdeep mentors across the Data & BI programs: Power BI dashboards, SQL for the questions behind them, and Excel for the analysis most teams still start in, with the reporting discipline that makes an analyst's numbers trusted on a Monday morning.
Applied Data Analytics Fellowship
How the weeks run
Built around a full-time job.
A counsellor confirms the exact days and times for your batch on the call.
1
Weeknight live classes
Two evenings a week with the mentor, on the work of the week.
2
Weekend lab
Project time with the mentor in the room: build, get stuck, get unstuck.
3
Recordings and 1:1 slots
Every class recorded the same day; 1:1 doubt-solving whenever you're stuck.
4
Final project review
Your projects reviewed like production work, with notes you can act on.
Data & BI
If this isn't quite the one.
Programs next to this one. A counsellor will tell you which fits what you do today.
Yes. The program assumes you know your work, not the tool. If you've never worked in the domain, a counsellor will point you to a better start.
Every class is recorded the same day, and 1:1 slots exist for exactly this. Most people who fall behind catch up in a week.
There is career support: mock interviews, profile reviews and referrals where we have them. Nobody honest can promise you a role; your projects make the case for you.
Both. Applied Data Analytics Fellowship is VILT (virtual instructor-led training): live online classes in the evenings and on weekends, in IST, recorded the same day so you can rewatch them. It runs 24–36 weeks, depending on your pace.
Designed for AI-native analyst roles: the Generative AI for Analysts module teaches prompting for SQL, Copilot in Power BI and Tableau Agent, and how to check what they produce.
SQL, Tableau, Power BI, Alteryx and Python, the way they are used at work, on projects modelled on the mentors' own. The curriculum section lists every module and topic.
Fees are not published on the site. A counsellor confirms the fee, GST and the instalment options in writing after one call; nothing is charged on the call.
Notes
Reading before you decide on Applied Data Analytics Fellowship.
Researched by the mentors, with every source and the date it was last checked.