Skip to content

Data analytics for working analysts, taught live online inside the Applied Data Analytics programmeAlteryx, SQL, Tableau and SharePoint

For analysts in banking, finance and large enterprisesReporting that runs itself

Alteryx for data preparation and automation, SQL for querying, Tableau for dashboards and SharePoint for lists and document libraries. The four tools are taught as seven modules inside the Applied Data Analytics programme, live online on weekends.

Designed for AI-native analyst roles: the Generative AI for Analysts module teaches prompting for SQL, Copilot in Power BI and Tableau Agent, and how to check what they produce.

  • 12 weeksthe full programme, live classes on weekends
  • 7 of 17 modules67 topics on these four tools
  • 4 toolsAlteryx, SQL, Tableau, SharePoint
  • VILTvirtual instructor-led, recorded the same day
View the curriculum

Part of Applied Data Analytics, a programme of seventeen modules.

What is this track?

7 of the 17 modules of Applied Data Analytics

This track is the Alteryx, SQL, Tableau and SharePoint part of Applied Data Analytics, a live online programme of seventeen modules. SQL goes from joins to indexing, execution plans, stored procedures and window functions. Alteryx Designer goes from the first workflow to macros, spatial analytics and publishing to Alteryx Server. Tableau goes from the first chart to LOD expressions, dashboard actions and publishing to Tableau Server and Tableau Cloud. SharePoint Fundamentals covers lists, document libraries, permissions and Power Automate flows. Classes run on weekends in IST, 2.5 hours on Saturday and 2.5 hours on Sunday, and are recorded the same day. The training is project-based: 7 assignments and 1 end-to-end live structured project at each level, modelled on the mentors' production work, with a weekly 1:1 review. The rest of the programme, including Power BI, Python and Generative AI for Analysts, is listed below.

Who this is for

For analysts who already report for a living.

You work with data in banking, finance or a large enterprise, and much of the week goes into preparing it by hand. The track covers the tools that take over the repeated steps.

  • You clean, join and re-export the same data every week
  • You know Excel well and want SQL, Alteryx and Tableau alongside it
  • Your team keeps its files and lists in SharePoint
  • You can give your weekends for the length of the programme

Probably not for you, yet

If you are new to analytics, the Excel, SQL, Power BI and Python modules of the same programme are the better start. A counsellor will say so on the call.

After the track

What you can do after these seven modules.

One for each tool, taken from what its modules teach. You practise each in project-based live training, on work modelled on the mentors' own, with a weekly 1:1 review.

  • 01

    Tune the SQL behind a report

    Write CTEs, window functions and stored procedures, and read an execution plan to find the slow step.

  • 02

    Build an Alteryx workflow that runs on a schedule

    Prepare and blend the data, reuse the logic as a macro, and publish the workflow to Alteryx Server with schedules and permissions.

  • 03

    Publish an interactive Tableau dashboard

    LOD expressions, parameters and dashboard actions, published to Tableau Server or Tableau Cloud with permissions and subscriptions.

  • 04

    Run team data on SharePoint

    Set up lists, document libraries and permissions, add approval flows with Power Automate, and connect a list to Excel and Power BI.

Curriculum

Four tools, each at three levels: Fundamentals, Advanced and Expert.

Fundamentals covers the interface and the basics, Advanced is where you build projects, and Expert covers integrations and advanced use of the tool. There are 7 assignments and 1 end-to-end live structured project at each level, reviewed by a mentor.

Alteryx

Alteryx

Three levels · taught in Alteryx Designer Foundations and Alteryx Designer Advanced

  1. Level 1 of 3

    Fundamentals

    The interface and the basics

    10 topics

    • Alteryx Designer: set-up in the Alteryx One app, and the interface
    • Your first workflow
    • Input and output: Excel, CSV, databases and cloud sources
    • Cleaning data: Select, Filter, Sort; nulls and duplicates
    • Formula, Join and Union
    • Blending and aggregating with Summarize
    All 10 topics
    • Simple reports; the predictive tools in brief
    • Debugging; containers, comments and dependencies
    • Working with Ask Alteryx
    • Designer Core certification preparation

    You build: A workflow that takes over a weekly clean, join and export job.

    7 assignments and 1 end-to-end live structured project

  2. Level 2 of 3

    Advanced

    Building projects

    9 topics

    • Complex formulas and functions
    • Parsing with RegEx; handling XML and JSON
    • Dynamic inputs and outputs; advanced joins
    • Reporting tools: Interactive Charts, Table, Layout and Overlay
    • Render and Email tools
    • Spatial analytics: spatial joins, drive time and trade areas
    All 9 topics
    • Macros: standard, batch and iterative
    • Performance and large datasets
    • Designer Advanced certification preparation

    You build: A reusable macro, and a reporting workflow that renders and emails its own output.

    7 assignments and 1 end-to-end live structured project

  3. Level 3 of 3

    Expert

    Integrations and advanced use

    9 topics

    • Publishing to Alteryx Server: schedules, permissions and sharing
    • The AMP engine and workflow performance
    • Parquet files and cloud warehouse connectors
    • Saving workflows to an Alteryx One workspace
    • Python and R inside a workflow
    • APIs with the Download and Parse tools
    All 9 topics
    • Feeding Tableau and Power BI from a workflow
    • AI tools in a workflow: the AI palette and the Prompt tool
    • Analytic apps with interface tools

    You build: A scheduled workflow on Alteryx Server that pulls from an API and feeds a Tableau dashboard.

    7 assignments and 1 end-to-end live structured project
SQL

SQL

Three levels · taught in SQL Foundations and SQL Advanced

  1. Level 1 of 3

    Fundamentals

    The interface and the basics

    9 topics

    • What SQL is and where it is used
    • Setting up PostgreSQL, MySQL and SQL Server
    • The query editor, basic commands and syntax
    • Importing tables from Excel and other sources
    • Query types: DDL, DML, DCL and TCL
    • Aggregate, string and date functions
    All 9 topics
    • Primary and foreign keys; constraints for data integrity
    • Joins: inner, outer, left, right, cross and self
    • Subqueries and nested queries

    You build: A small database loaded from files, and the queries behind a sales report.

    7 assignments and 1 end-to-end live structured project

  2. Level 2 of 3

    Advanced

    Building projects

    8 topics

    • CTEs and window functions for reporting
    • Stored procedures with parameters
    • Triggers, before and after, with real use cases
    • Transactions and ACID: commit, rollback and savepoints
    • Isolation levels, concurrency and deadlocks
    • Dynamic SQL and preventing SQL injection
    All 8 topics
    • Storing and querying JSON
    • Materialized views and refresh strategies

    You build: A reporting layer for a month-end report: procedures, CTEs and window-function queries.

    7 assignments and 1 end-to-end live structured project
  3. Level 3 of 3

    Expert

    Integrations and advanced use

    7 topics

    • Indexing: creation, maintenance and fragmentation
    • Query optimisation with indexing and caching
    • Reading an execution plan to find the slow step
    • Choosing between an index, a rewritten query and a materialized view
    • Database security: role-based access and encryption basics
    • SQL on a cloud warehouse: T-SQL on Microsoft Fabric Warehouse
    • Custom SQL queries in Tableau

    You build: A slow report query tuned and documented: the plan before, the plan after, and why.

    7 assignments and 1 end-to-end live structured project
Tableau

Tableau

Three levels · taught in Tableau Desktop Essentials and Tableau Desktop Advanced

  1. Level 1 of 3

    Fundamentals

    The interface and the basics

    9 topics

    • The Tableau product suite, set-up and interface
    • Connecting to Excel, CSV and databases; live and extract
    • Joins, unions and relationships; when to relate, when to join
    • Tableau Prep for cleaning; pivoting and splitting columns
    • Bar, line and pie charts; filters, groups and sets
    • Calculated fields: arithmetic, IF and CASE, aggregations
    All 9 topics
    • Table calculations
    • Maps: geographic roles and layers
    • Dashboards and stories; sharing on Tableau Public

    You build: A first dashboard and story, published to Tableau Public.

    7 assignments and 1 end-to-end live structured project

  2. Level 2 of 3

    Advanced

    Building projects

    10 topics

    • Dual-axis and combined charts; bullet graphs, heatmaps, treemaps
    • Waterfall charts and box plots
    • Parameters for interactive views
    • LOD (level of detail) expressions
    • Advanced table calculations: moving averages and rank
    • Dashboard actions: filter, highlight, URL, set and parameter
    All 10 topics
    • Dynamic zone visibility
    • Advanced mapping: custom geocoding, spatial files, density maps
    • Performance: extracts and large datasets
    • Tableau Desktop Foundations certification preparation

    You build: An interactive, parameter-driven dashboard for a leadership review.

    7 assignments and 1 end-to-end live structured project

  3. Level 3 of 3

    Expert

    Integrations and advanced use

    9 topics

    • Cloud databases: AWS, Snowflake and Google BigQuery
    • Custom SQL and data blending
    • Publishing to Tableau Server and Tableau Cloud
    • Permissions, user roles, alerts and subscriptions
    • Building and publishing a Tableau Prep flow
    • Python and R with TabPy and RServe
    All 9 topics
    • Tableau APIs for custom solutions
    • Tableau Pulse and Tableau Agent
    • Published data sources, and row-level security with user filters

    You build: A dashboard on Tableau Server or Tableau Cloud with permissions and subscriptions, fed by a Prep flow.

    7 assignments and 1 end-to-end live structured project
SharePoint

SharePoint

Three levels · taught in SharePoint Fundamentals

  1. Level 1 of 3

    Fundamentals

    The interface and the basics

    8 topics

    • What SharePoint is, and its business use cases
    • SharePoint architecture in brief
    • SharePoint Online, OneDrive and Microsoft Teams: which does what
    • Document libraries and folders
    • Metadata and structured document management
    • Version control and file history
    All 8 topics
    • Lists: lists and Excel tables, columns and data types
    • Custom views

    You build: A team site with a document library and a tracker list.

    7 assignments and 1 end-to-end live structured project

  2. Level 2 of 3

    Advanced

    Building projects

    8 topics

    • Permission inheritance, and breaking it
    • Site, library and item-level permissions
    • Permission groups and custom permissions
    • Secure internal and external file sharing
    • Governance and best practices
    • Organising sites, libraries and lists
    All 8 topics
    • Real collaboration scenarios, built end to end
    • Calculated columns, column validation and list formatting

    You build: A governed workspace for a reporting process, with the right access for each role.

    7 assignments and 1 end-to-end live structured project
  3. Level 3 of 3

    Expert

    Integrations and advanced use

    7 topics

    • Power Automate: approval and notification flows on a list
    • List rules in place of classic alerts
    • Power Automate flows in place of the retired SharePoint 2013 workflows
    • Connecting SharePoint lists with Excel and Power BI
    • Analytics and reporting integration
    • Reading SharePoint lists and files from Alteryx and Tableau
    • A Power Apps form on a SharePoint list

    You build: An approval flow on a list, with the list feeding a live report in Excel or Power BI.

    7 assignments and 1 end-to-end live structured project
Also in the programme

Ten more modules in Applied Data Analytics.

The programme has seventeen modules. These ten are taught in the same programme as the four tools above; the full programme page lists every topic.

  • Excel/VBA Foundations9 topics
  • Excel/VBA Advanced11 topics
  • Descriptive Statistics10 topics
  • Visual Science for Data Visualization10 topics
  • Power BI Foundations8 topics
  • Power BI Advanced11 topics
  • Python Foundations10 topics
  • EDA with Python12 topics
  • Generative AI for Analysts4 topics
  • Communication Skills4 topics
See the full Applied Data Analytics programme

Tools

The four tools this track leads with.

You use each one on the kind of data your mentors handle at work, not on a toy example.

  • Alteryx
    Alteryx
  • SQL
    SQL
  • Tableau
    Tableau
  • SharePoint
    SharePoint

Also taught in the programme

  • Excel
    Excel
  • Tableau
    Tableau
  • Power BI
    Power BI
  • Python
    Python
  • Alteryx
    Alteryx
  • Statistics
    Statistics
  • Generative AI
    Generative AI

Prepares you for

The exams are the vendors' own, taken separately; TTFA is not affiliated with them.

TTFA Academy is an independent training provider. It is not affiliated with, endorsed by or a partner of Microsoft, Salesforce or Alteryx. Microsoft, Power BI, Excel and Fabric are trademarks of the Microsoft group of companies. Tableau is a trademark of Salesforce, Inc. Alteryx is a trademark of Alteryx, Inc. Names are used only to identify the tools taught.

AI-native

AI is taught inside each tool, and as a module of its own.

Designed for AI-native analyst roles: the Generative AI for Analysts module teaches prompting for SQL, Copilot in Power BI and Tableau Agent, and how to check what they produce.

AI inside each tool

  • Alteryx

    Alteryx

    Ask Alteryx, and AI tools in a workflow

    • Asking the built-in assistant to add and connect tools
    • Checking what the assistant built before you run it
    • The AI tools palette and the Prompt tool
    • Where an AI step belongs in a workflow, and where it doesn’t

    Taught in Alteryx Designer Foundations and Alteryx Designer Advanced

  • SQL

    SQL

    Prompting for SQL

    • Turning a plain-language question into a query
    • Giving the assistant the schema: table and column names
    • Explaining, fixing and documenting a query with an assistant

    Taught in Generative AI for Analysts

  • Tableau

    Tableau

    Tableau Pulse and Tableau Agent

    • Defining a metric in Tableau Pulse and following it
    • Using Tableau Agent to draft a viz or a calculation
    • Checking what the agent produced

    Taught in Tableau Desktop Advanced

  • SharePoint

    SharePoint

    Copilot in Power Automate

    • Describing a flow in plain words and letting Copilot draft it
    • Checking each step before the flow is switched on

The module · 4 topics

Generative AI for Analysts, topic by topic

An assistant drafts; you answer for the number. These topics include how to check what an assistant gives you, and how to keep data private while you use one.

  1. Topic 1

    Prompting for SQL

    • Turning a plain-language question into a query
    • Giving the assistant the schema: table and column names
    • Explaining, fixing and documenting a query with an assistant
  2. Topic 2

    Assistants inside BI Tools

    • Copilot in Power BI: DAX, report pages and summaries
    • Tableau Agent: vizzes and calculations
    • What each one needs to run: licences and capacity
  3. Topic 3

    Checking AI Output

    How you check AI output

    • Reading the query before running it
    • Testing on a case you already know the answer to
    • Reconciling totals against a number you trust
  4. Topic 4

    Data Privacy with AI Tools

    How you keep data private

    • What enterprise assistants do with your prompts, and what consumer chatbots do
    • Keeping customer data out of public tools
    • India’s DPDP Rules: what changes for personal data

What a project looks like

Brief, build, review. Like work.

One end-to-end live structured project at each level. Each one is modelled on a mentor's real production work, never on client data.
  • The brief

    A one-page brief the way a manager would write it: the ask, the data, the deadline, what “done” means.

  • The build

    You build it over the level, with a 1:1 review every week. The mentor reviews the work-in-progress.

  • The review

    A production-style review: what would break, what a senior would change, what to say about it in an interview.

LMS experience

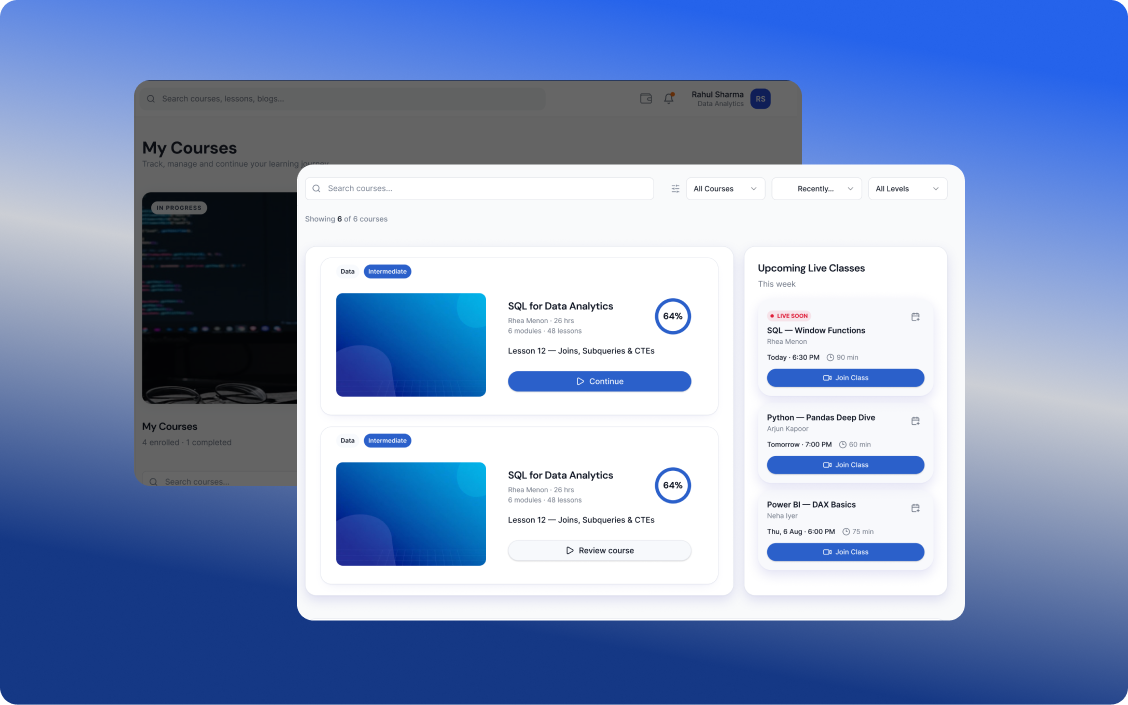
Your complete learning journey, all in one place

Learn at your pace, practise through real-world projects, build your skills, earn certifications, and discover opportunities that match your potential.

Learn and build skills
Step 01

Learn and build skills

Complete industry-relevant courses designed to build practical skills and prepare you for real-world applications.

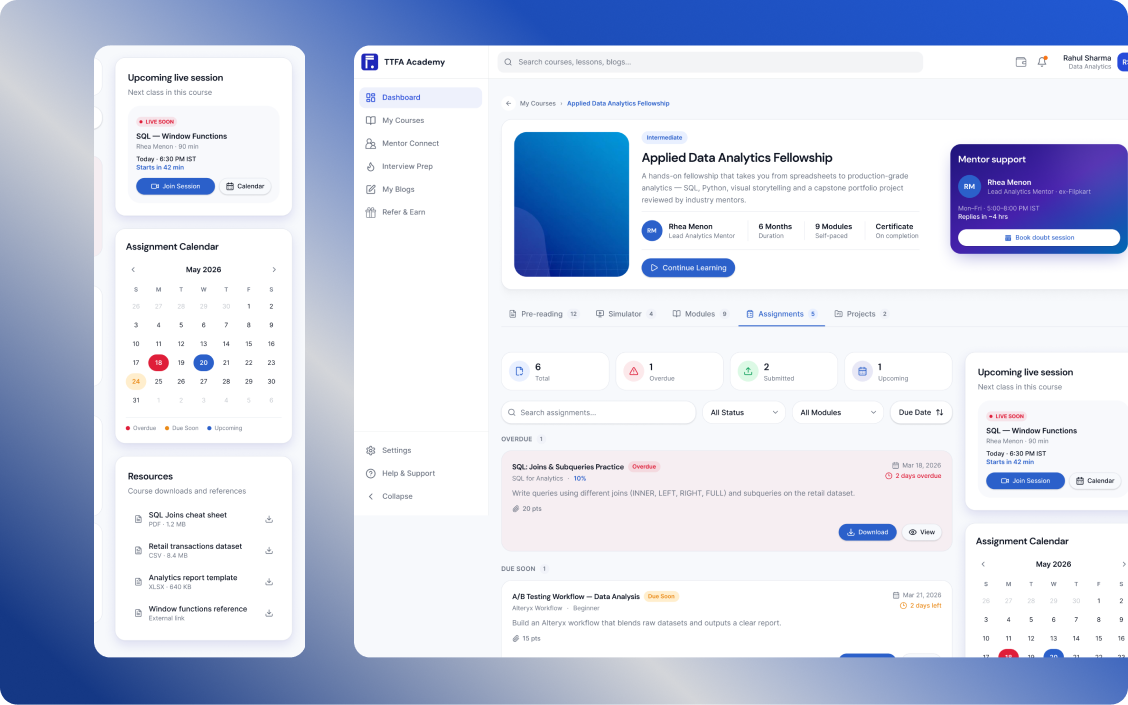
  • Hands-on learning
  • Practical assignments and projects
  • Industry-aligned curriculum
Learn through real projects
Step 02

Learn through real projects

Put your learning into practice with assignments and hands-on projects designed to build practical skills and help you grow with confidence.

  • Practical assignments to strengthen your skills
  • Real-world projects to apply what you learn
  • Build experience and grow your portfolio
Learn by doing
Step 03

Learn by doing

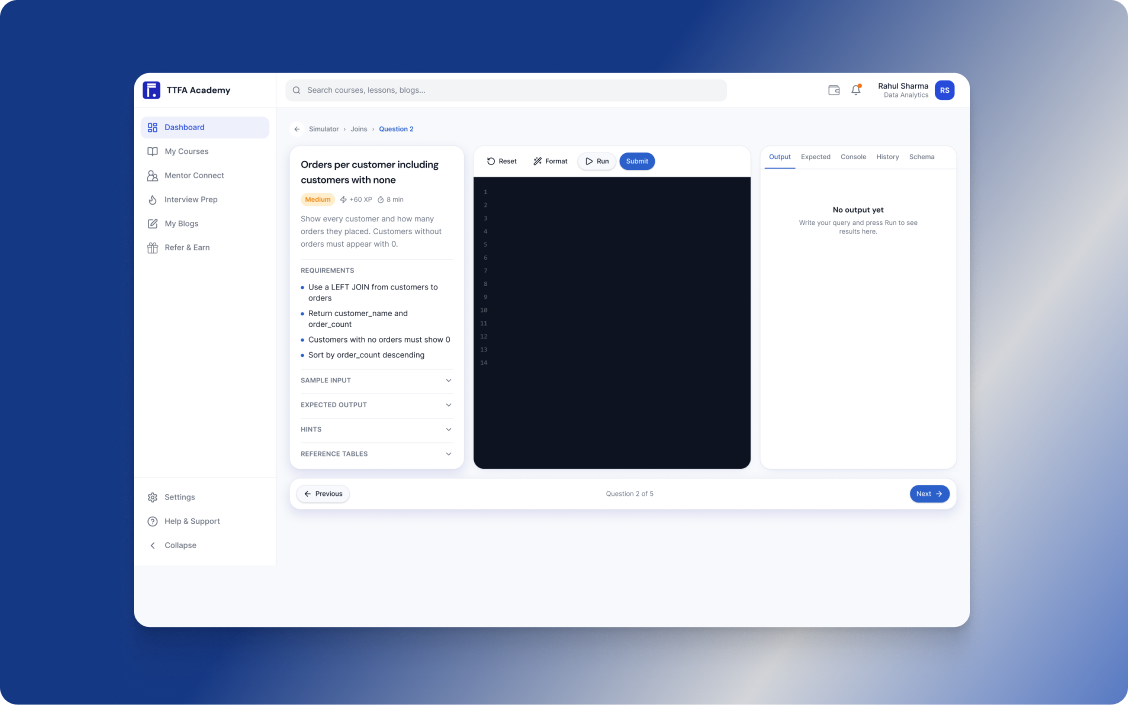
Practise real-world tasks with interactive simulators that help you apply your knowledge, sharpen your skills, and prepare for the workplace.

  • Real-world practice
  • Interactive simulations
  • Build skills with confidence
Discover your next opportunity
Step 04

Discover your next opportunity

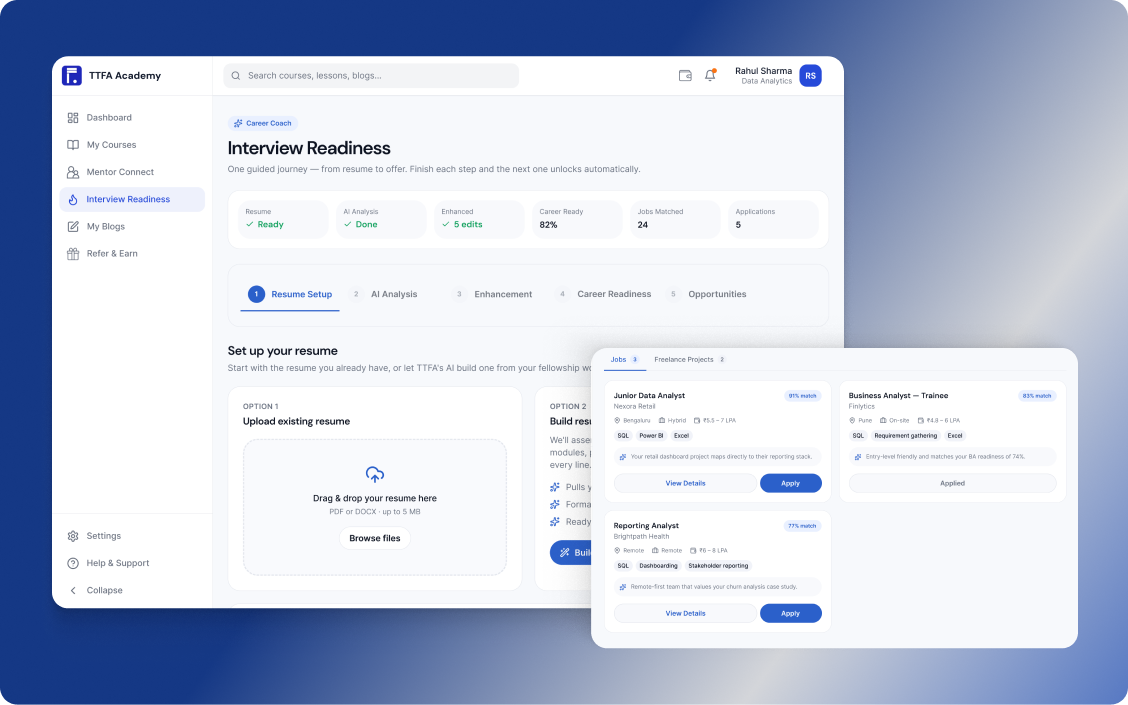
Upload and enhance your resume, then discover job and freelance opportunities matched to your skills, experience, and career goals.

  • AI-powered resume enhancement
  • Personalised job and freelance recommendations
  • Apply to opportunities that match your profile
Earn certifications as you grow
Step 05

Earn certifications as you grow

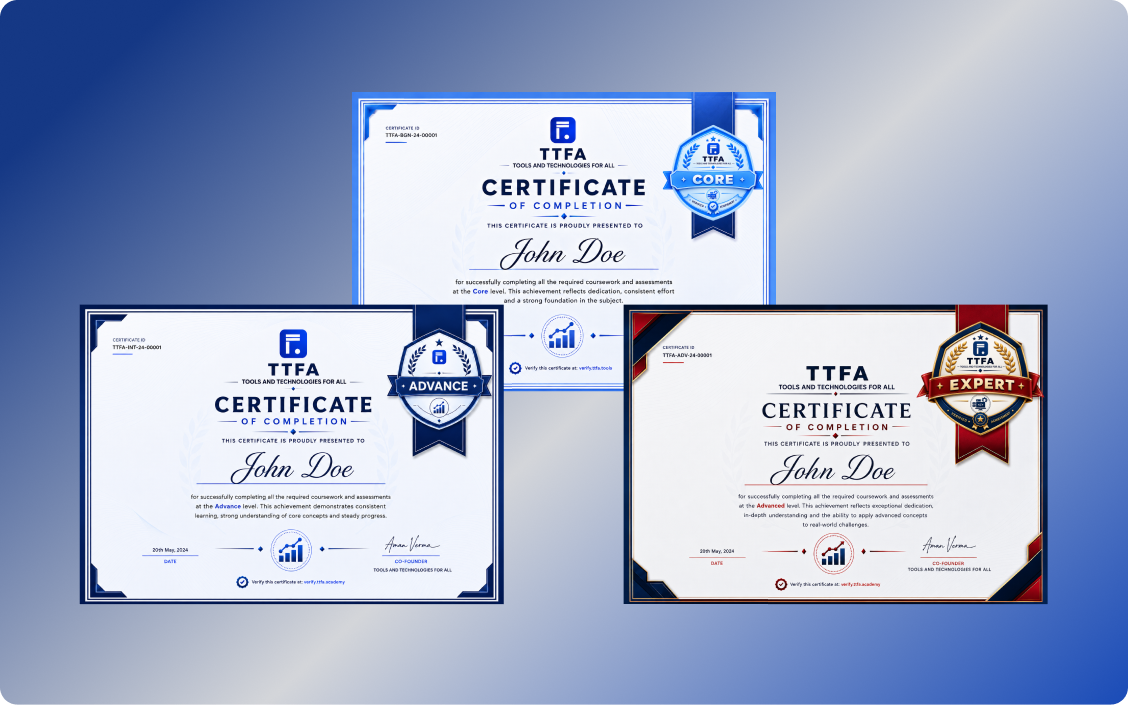
Complete projects, build your skills, and unlock certifications at each level as you progress through your learning journey.

  • Fundamentals
  • Advanced
  • Expert

Faculty

You learn the work, not only the tool.

TTFA Academy brings practitioners from Fortune 500 companies, each with 10 to 12 years of experience. You learn the real challenges of the work from people who have met them, not only how to use the tools.

What that means in class

  • Project-based live training on weekends

    Live classes of 2.5 hours on Saturday and on Sunday, built around projects modelled on production work rather than on a toy example.

  • The weekly 1:1 review

    Once a week you go through your own work with a practitioner: what holds, what breaks, and what to change before the next class.

  • Feedback on the 7 assignments at each level

    Each assignment comes back with comments from someone who does this work, before the end-to-end live structured project of that level.
  • Production habits

    Naming, documenting, checking totals and handing work over, the way it is done on a team where other people rely on the number.

What a tool lesson teaches, and what a practitioner adds

  • A tool lesson teachesHow to write a join

    A practitioner addsWhy the totals change after a join, and how to check them

  • A tool lesson teachesHow to build a dashboard

    A practitioner addsWhat a manager asks in the first minute

  • A tool lesson teachesHow to automate a report

    A practitioner addsWhat to do on the morning the refresh fails

  • A tool lesson teachesHow to use an AI assistant

    A practitioner addsWhen not to trust it, and how to test it

How the weeks run

Built around a full-time job.

A counsellor confirms the exact days and times on the call.

  1. Saturday live class

    2.5 hours with the mentor, on the work of the week.

  2. Sunday live class

    2.5 hours more: 5 hours of live class a weekend, built around the project.

  3. Weekly 1:1 review

    A 1:1 review with a mentor every week; every class is recorded the same day.

  4. Assignments and the live project

    7 assignments and 1 end-to-end live structured project at each level, reviewed like production work.
Plans and prices

Subscription plans

Three plans for this track. Pick how you want to learn: at your own pace, live with career preparation, or with everything included.

This is the price of the track. The full Applied Data Analytics programme, with all 17 modules, is ₹19,999 / ₹39,999 / ₹59,999. See the full programme's plans

  • Launch price on Pro: ₹9,999
  • Every price includes GST
  • Instalments available: a counsellor confirms the options in writing
  • Premium

    Most chosen

    Live training and career preparation

    For learners who want live classes, mentor feedback and career preparation.

    List price ₹25,999

    Plan price ₹19,999

    Save ₹6,000

    incl. GST · instalments available

    • Live weekend classes with working professionals: 2.5 hours on Saturday and on Sunday
    • One batch (batch changes are not included)
    • All three levels: Fundamentals, Advanced and Expert
    • 7 assignments and 1 end-to-end live structured project at each level, with mentor feedbackIn this track: 84 assignments and 12 live projects, across its 4 tools.
    • A weekly 1:1 review
    • Real-world case studies
    • Resume preparation, mock interviews and career guidance
    • LMS access for 2 years

Questions about the plans

A counsellor answers anything else on a call. Nothing is charged on the call.

Questions

About this track.

Anything else: ask on the call.

The full Applied Data Analytics programme

It is part of it. Alteryx, SQL, Tableau and SharePoint make up seven of the seventeen modules of Applied Data Analytics. The programme also teaches Excel and VBA, Power BI, Python, descriptive statistics, visual science for data visualisation, Generative AI for Analysts and communication skills. There is one programme; this page shows the part these four tools cover.

Bring your current reporting work to the call.

A counsellor looks at what you do today and tells you, straight, whether Applied Data Analytics is the right next step.

See the full Applied Data Analytics programme