Skip to content

Data analytics for a career switch, taught live online inside the Applied Data Analytics programmeExcel, SQL, Power BI and Python

For career switchers and people new to analyticsData Analyst

Excel for reporting, SQL for querying, Power BI for dashboards and Python for analysis. The four tools are taught as eight modules inside the Applied Data Analytics programme, live online on weekends.

Designed for AI-native analyst roles: the Generative AI for Analysts module teaches prompting for SQL, Copilot in Power BI and Tableau Agent, and how to check what they produce.

  • 12 weeksthe full programme, live classes on weekends
  • 8 of 17 modules84 topics on these four tools
  • 4 toolsExcel, SQL, Power BI, Python
  • VILTvirtual instructor-led, recorded the same day
View the curriculum

Part of Applied Data Analytics, a programme of seventeen modules.

What is this track?

8 of the 17 modules of Applied Data Analytics

This track is the Excel, SQL, Power BI and Python part of Applied Data Analytics, a live online programme of seventeen modules. Each of the four tools starts with a foundations module and goes on to an advanced one: SQL from the first query to window functions, Excel from formulas and pivot tables to VBA and Power Query, Power BI from the first report to DAX and row-level security, Python from the basics to exploratory data analysis. Classes run on weekends in IST, 2.5 hours on Saturday and 2.5 hours on Sunday, and are recorded the same day. The training is project-based: 7 assignments and 1 end-to-end live structured project at each level, modelled on the mentors' production work, with a weekly 1:1 review. The rest of the programme, including Tableau, Alteryx and Generative AI for Analysts, is listed below.

Who this is for

For people moving into analytics.

You have not worked as an analyst yet. Each of the four tools starts from its foundations module, so the track does not assume you already know it.

  • You want to move into a data analyst role from another line of work
  • You use Excel a little, and have not written SQL or Python
  • You can give your weekends for the length of the programme
  • You would rather show working projects than a certificate

Probably not for you, yet

If you already write SQL and build dashboards at work, the Alteryx and Tableau modules of the same programme may matter more to you. A counsellor will say so on the call.

After the track

What you can do after these eight modules.

One for each tool, taken from what its modules teach. You practise each in project-based live training, on work modelled on the mentors' own, with a weekly 1:1 review.

  • 01

    Query a database yourself

    Write SQL with joins, subqueries, CTEs and window functions, and read an execution plan to find the slow step.

  • 02

    Build and automate an Excel report

    Pivot tables, lookup functions and Power Query connections, with VBA or an Office Script for the repeated steps.

  • 03

    Publish a Power BI dashboard

    Model the data, write DAX measures, set up row-level security and publish the report to the Power BI Service with a scheduled refresh.

  • 04

    Explore a dataset in Python

    Load, clean and chart data with pandas, Matplotlib and Seaborn, and present the findings as a data story.

Curriculum

Four tools, each at three levels: Fundamentals, Advanced and Expert.

Fundamentals covers the interface and the basics, Advanced is where you build projects, and Expert covers integrations and advanced use of the tool. There are 7 assignments and 1 end-to-end live structured project at each level, reviewed by a mentor.

Excel

Excel

Three levels · taught in Excel/VBA Foundations and Excel/VBA Advanced

  1. Level 1 of 3

    Fundamentals

    The interface and the basics

    8 topics

    • Excel walkthrough: workbooks, worksheets, ribbon and toolbar
    • Formatting data: conditional formatting, filters and sorting
    • Basic formulas (SUM, AVERAGE, COUNT) and error checking
    • First charts and pivot tables
    • Protecting workbooks and worksheets
    • Access walkthrough: database design, tables and fields
    All 8 topics
    • Access queries, filters and data entry forms
    • Relationships between tables and database documentation

    You build: A formatted sales workbook with formulas, a pivot table and a chart, and a small Access database behind it.

    7 assignments and 1 end-to-end live structured project

  2. Level 2 of 3

    Advanced

    Building projects

    8 topics

    • Advanced charts and customised pivot tables
    • Nested formulas and logical functions
    • Lookups: VLOOKUP, HLOOKUP and XLOOKUP
    • Power Query: connecting and importing external data
    • Formula errors, data validation and auditing
    • VBA fundamentals: macros, variables, constants and data types
    All 8 topics
    • VBA programming: loops, branching, user forms and controls
    • Automating reports and data processing with VBA; debugging

    You build: An Excel data capture tool, and a monthly report that builds itself with VBA.

    7 assignments and 1 end-to-end live structured project

  3. Level 3 of 3

    Expert

    Integrations and advanced use

    9 topics

    • Office Scripts: recording and editing a script
    • Running a script on a schedule with Power Automate
    • When to use VBA and when to use Office Scripts
    • Automating emails with Power Automate
    • Python in Excel: Python in a cell, pandas on a worksheet range
    • Batch automation scripts
    All 9 topics
    • Connecting SharePoint lists with Excel
    • Dynamic arrays and LAMBDA: FILTER, UNIQUE and LET
    • Power Pivot and the Excel data model

    You build: A report that refreshes from its sources and is emailed on a schedule, with no manual step.

    7 assignments and 1 end-to-end live structured project
SQL

SQL

Three levels · taught in SQL Foundations and SQL Advanced

  1. Level 1 of 3

    Fundamentals

    The interface and the basics

    9 topics

    • What SQL is and where it is used
    • Setting up PostgreSQL, MySQL and SQL Server
    • The query editor, basic commands and syntax
    • Importing tables from Excel and other sources
    • Query types: DDL, DML, DCL and TCL
    • Aggregate, string and date functions
    All 9 topics
    • Primary and foreign keys; constraints for data integrity
    • Joins: inner, outer, left, right, cross and self
    • Subqueries and nested queries

    You build: A small database loaded from files, and the queries behind a sales report.

    7 assignments and 1 end-to-end live structured project

  2. Level 2 of 3

    Advanced

    Building projects

    8 topics

    • CTEs and window functions for reporting
    • Stored procedures with parameters
    • Triggers, before and after, with real use cases
    • Transactions and ACID: commit, rollback and savepoints
    • Isolation levels, concurrency and deadlocks
    • Dynamic SQL and preventing SQL injection
    All 8 topics
    • Storing and querying JSON
    • Materialized views and refresh strategies

    You build: A reporting layer for a month-end report: procedures, CTEs and window-function queries.

    7 assignments and 1 end-to-end live structured project

  3. Level 3 of 3

    Expert

    Integrations and advanced use

    7 topics

    • Indexing: creation, maintenance and fragmentation
    • Query optimisation with indexing and caching
    • Reading an execution plan to find the slow step
    • Choosing between an index, a rewritten query and a materialized view
    • Database security: role-based access and encryption basics
    • SQL on a cloud warehouse: T-SQL on Microsoft Fabric Warehouse
    • SQL from Python: querying a database from a notebook

    You build: A slow report query tuned and documented: the plan before, the plan after, and why.

    7 assignments and 1 end-to-end live structured project

Power BI

Power BI

Three levels · taught in Power BI Foundations and Power BI Advanced

  1. Level 1 of 3

    Fundamentals

    The interface and the basics

    8 topics

    • The Power BI ecosystem: Desktop, Service, Mobile and Gateway
    • Connecting to Excel, CSV and databases
    • Import, DirectQuery and Direct Lake modes
    • Cleaning and transforming data in Power Query
    • Relationships, star and snowflake schemas
    • Charts, slicers, filters and drill-through
    All 8 topics
    • DAX basics: calculated columns, simple measures, IF and SWITCH
    • Publishing, sharing and mobile layouts

    You build: A first interactive sales dashboard, published to the Power BI Service.

    7 assignments and 1 end-to-end live structured project

  2. Level 2 of 3

    Advanced

    Building projects

    9 topics

    • Advanced Power Query: parameters, functions, JSON, XML and APIs
    • Advanced modelling: calculated tables, role-playing dimensions, aggregations
    • Advanced DAX: CALCULATE, FILTER, RANKX and evaluation context
    • Time intelligence: YTD, QTD, MTD and rolling averages
    • Calculation groups, visual calculations and DAX query view
    • Bookmarks, custom visuals, tooltips and KPI cards
    All 9 topics
    • Row-level security: static, dynamic and tested
    • Performance Analyzer and model optimisation
    • PL-300 certification preparation

    You build: A multi-page management dashboard on a star schema, with row-level security.

    7 assignments and 1 end-to-end live structured project

  3. Level 3 of 3

    Expert

    Integrations and advanced use

    9 topics

    • Power BI Service: workspaces, shared semantic models and dataflows
    • Scheduled and incremental refresh
    • Sensitivity labels, workspace roles and endorsement
    • Power BI inside Microsoft Fabric: OneLake, lakehouse, Dataflows Gen2
    • Integration with Azure, SQL Server and SharePoint
    • Power Automate and the Power BI REST API
    All 9 topics
    • Deployment pipelines, Git integration and Power BI Project files
    • Paginated reports, and embedding with Power Apps
    • Copilot in Power BI: preparing a semantic model for AI

    You build: A report promoted from development to production through a pipeline, refreshed on a schedule and ready for Copilot.

    7 assignments and 1 end-to-end live structured project

Python

Python

Three levels · taught in Python Foundations and EDA with Python

  1. Level 1 of 3

    Fundamentals

    The interface and the basics

    8 topics

    • Why Python for analytics; syntax, naming and indentation
    • Variables, data types, operators and type casting
    • Input and output
    • Conditional statements and loops
    • Functions: arguments, lambda and functional ideas
    • Modules, packages and common libraries
    All 8 topics
    • Lists, tuples, sets and dictionaries; comprehensions
    • Strings, files, exceptions and regular expressions

    You build: Scripts that read a file, clean it and write a summary.

    7 assignments and 1 end-to-end live structured project

  2. Level 2 of 3

    Advanced

    Building projects

    8 topics

    • pandas: grouping, aggregation, sorting, filtering and joining
    • pandas 3: Copy-on-Write and the string data type
    • Loading CSV, Excel and JSON; head(), info() and describe()
    • Missing values, duplicates and outliers (Z-score, IQR)
    • Encoding categorical data
    • Charts with Matplotlib and Seaborn, from histograms to violin plots
    All 8 topics
    • Multivariate and time series analysis
    • Reproducibility, documentation and presentation-ready insights

    You build: The capstone: EDA on a complex dataset such as sales, fraud detection or customer segmentation, presented as a data story.

    7 assignments and 1 end-to-end live structured project
  3. Level 3 of 3

    Expert

    Integrations and advanced use

    8 topics

    • SQL from Python: querying a database from a notebook
    • Python in Excel: pandas on a worksheet range
    • Automated EDA with ydata-profiling and Sweetviz
    • Interactive dashboards: Plotly with Dash or Streamlit
    • Python inside Tableau with TabPy
    • The Python tool in an Alteryx workflow
    All 8 topics
    • Calling a REST API and reading JSON with requests
    • Running a notebook or script on a schedule

    You build: An interactive dashboard app on data queried live from a database.

    7 assignments and 1 end-to-end live structured project
Also in the programme

Nine more modules in Applied Data Analytics.

The programme has seventeen modules. These nine are taught in the same programme as the four tools above; the full programme page lists every topic.

  • SharePoint Fundamentals8 topics
  • Alteryx Designer Foundations8 topics
  • Alteryx Designer Advanced11 topics
  • Descriptive Statistics10 topics
  • Visual Science for Data Visualization10 topics
  • Tableau Desktop Essentials7 topics
  • Tableau Desktop Advanced10 topics
  • Generative AI for Analysts4 topics
  • Communication Skills4 topics
See the full Applied Data Analytics programme

Tools

The four tools this track leads with.

You use each one on the kind of data your mentors handle at work, not on a toy example.

  • Excel
    Excel
  • SQL
    SQL
  • Power BI
    Power BI
  • Python
    Python

Also taught in the programme

  • SharePoint
    SharePoint
  • Tableau
    Tableau
  • Power BI
    Power BI
  • Alteryx
    Alteryx
  • Statistics
    Statistics
  • Generative AI
    Generative AI

Prepares you for

The exams are the vendors' own, taken separately; TTFA is not affiliated with them.

TTFA Academy is an independent training provider. It is not affiliated with, endorsed by or a partner of Microsoft, Salesforce or Alteryx. Microsoft, Power BI, Excel and Fabric are trademarks of the Microsoft group of companies. Tableau is a trademark of Salesforce, Inc. Alteryx is a trademark of Alteryx, Inc. Names are used only to identify the tools taught.

AI-native

AI is taught inside each tool, and as a module of its own.

Designed for AI-native analyst roles: the Generative AI for Analysts module teaches prompting for SQL, Copilot in Power BI and Tableau Agent, and how to check what they produce.

AI inside each tool

  • Excel

    Excel

    Python in Excel

    • Writing Python in a cell
    • Using pandas on a worksheet range

    Taught in Excel/VBA Advanced

  • SQL

    SQL

    Prompting for SQL

    • Turning a plain-language question into a query
    • Giving the assistant the schema: table and column names
    • Explaining, fixing and documenting a query with an assistant

    Taught in Generative AI for Analysts

  • Power BI

    Power BI

    Copilot in Power BI

    • Creating a report page and a narrative visual with Copilot
    • Preparing a semantic model for AI: descriptions, verified answers, AI instructions
    • What Copilot needs to run: Fabric capacity, not a Pro licence alone

    Taught in Power BI Advanced

  • Python

    Python

    An assistant beside your notebook

    • Asking an assistant to explain or fix a piece of code
    • Running it on a case you already know the answer to

The module · 4 topics

Generative AI for Analysts, topic by topic

An assistant drafts; you answer for the number. These topics include how to check what an assistant gives you, and how to keep data private while you use one.

  1. Topic 1

    Prompting for SQL

    • Turning a plain-language question into a query
    • Giving the assistant the schema: table and column names
    • Explaining, fixing and documenting a query with an assistant
  2. Topic 2

    Assistants inside BI Tools

    • Copilot in Power BI: DAX, report pages and summaries
    • Tableau Agent: vizzes and calculations
    • What each one needs to run: licences and capacity
  3. Topic 3

    Checking AI Output

    How you check AI output

    • Reading the query before running it
    • Testing on a case you already know the answer to
    • Reconciling totals against a number you trust
  4. Topic 4

    Data Privacy with AI Tools

    How you keep data private

    • What enterprise assistants do with your prompts, and what consumer chatbots do
    • Keeping customer data out of public tools
    • India’s DPDP Rules: what changes for personal data

What a project looks like

Brief, build, review. Like work.

One end-to-end live structured project at each level. Each one is modelled on a mentor's real production work, never on client data.
  • The brief

    A one-page brief the way a manager would write it: the ask, the data, the deadline, what “done” means.

  • The build

    You build it over the level, with a 1:1 review every week. The mentor reviews the work-in-progress.

  • The review

    A production-style review: what would break, what a senior would change, what to say about it in an interview.

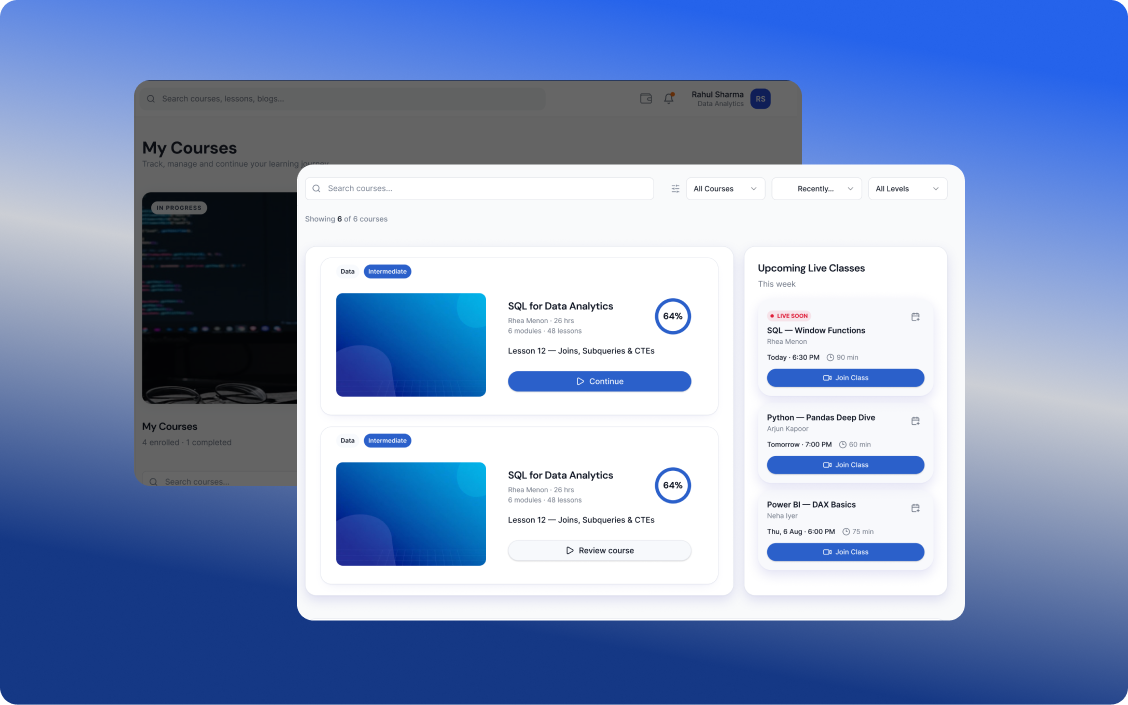
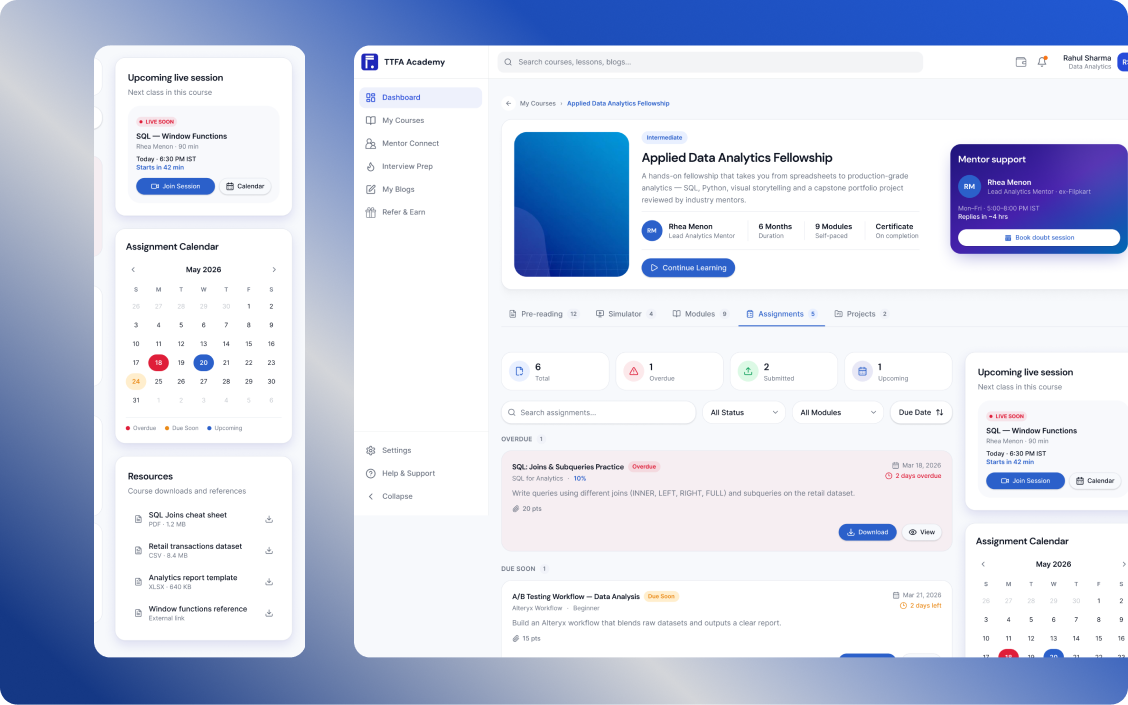
LMS experience

Your complete learning journey, all in one place

Learn at your pace, practise through real-world projects, build your skills, earn certifications, and discover opportunities that match your potential.

Learn and build skills
Step 01

Learn and build skills

Complete industry-relevant courses designed to build practical skills and prepare you for real-world applications.

  • Hands-on learning
  • Practical assignments and projects
  • Industry-aligned curriculum
Learn through real projects
Step 02

Learn through real projects

Put your learning into practice with assignments and hands-on projects designed to build practical skills and help you grow with confidence.

  • Practical assignments to strengthen your skills
  • Real-world projects to apply what you learn
  • Build experience and grow your portfolio
Learn by doing
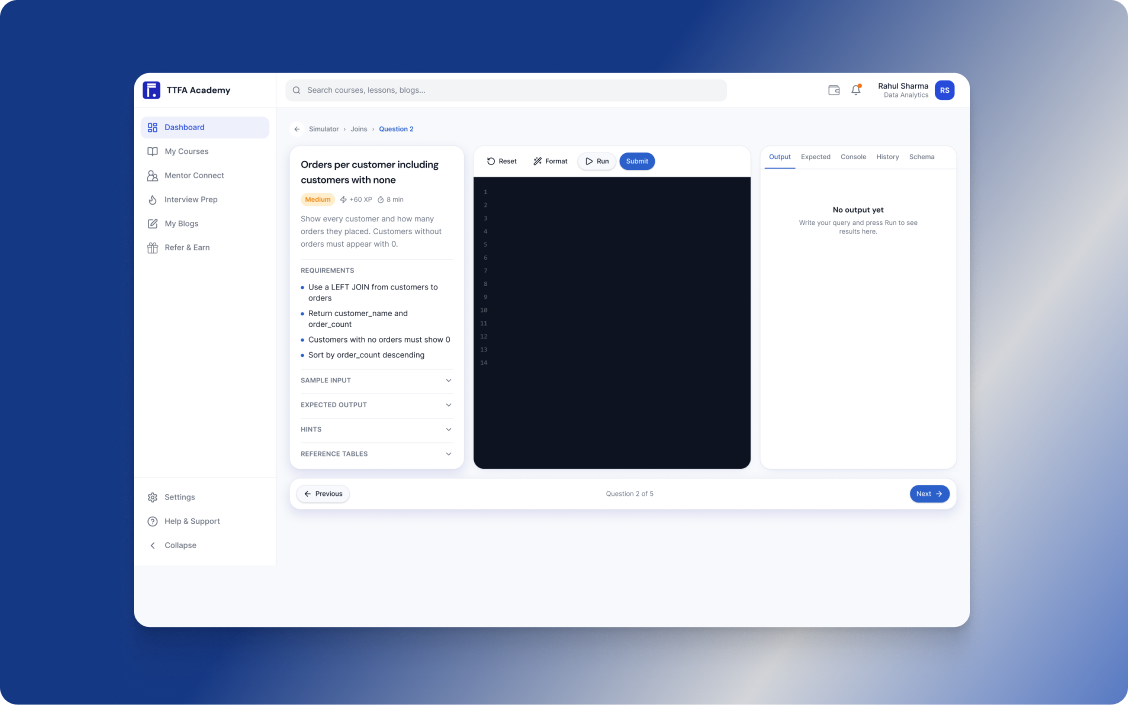
Step 03

Learn by doing

Practise real-world tasks with interactive simulators that help you apply your knowledge, sharpen your skills, and prepare for the workplace.

  • Real-world practice
  • Interactive simulations
  • Build skills with confidence
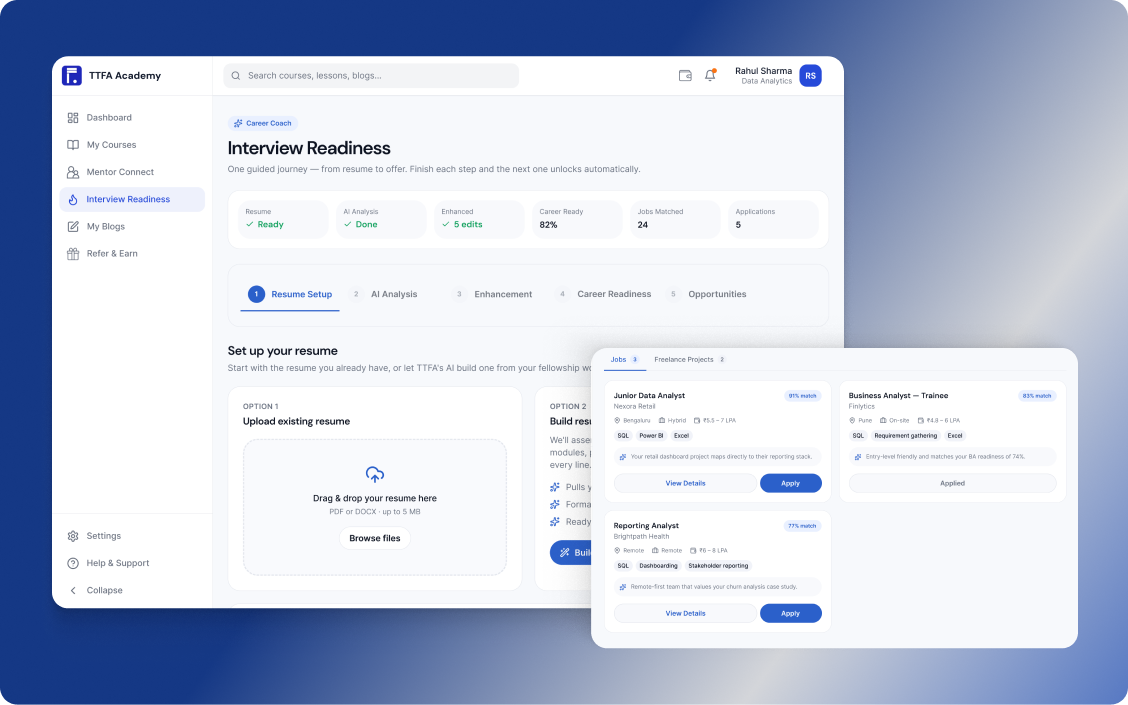
Discover your next opportunity
Step 04

Discover your next opportunity

Upload and enhance your resume, then discover job and freelance opportunities matched to your skills, experience, and career goals.

  • AI-powered resume enhancement
  • Personalised job and freelance recommendations
  • Apply to opportunities that match your profile
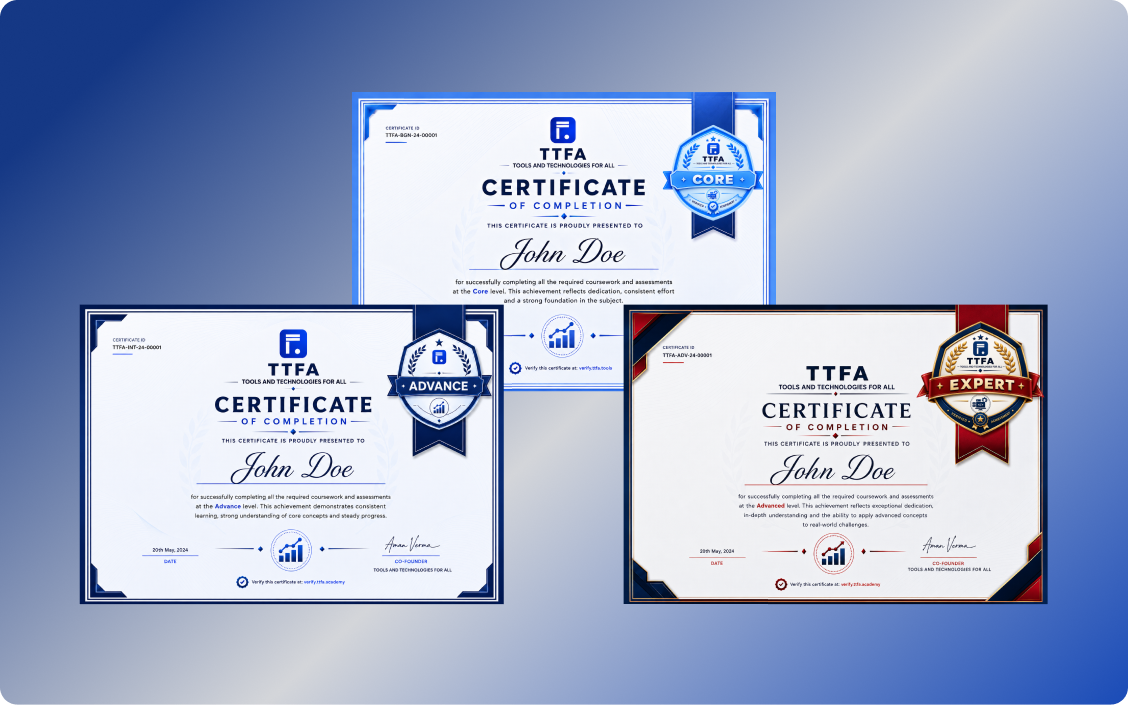
Earn certifications as you grow
Step 05

Earn certifications as you grow

Complete projects, build your skills, and unlock certifications at each level as you progress through your learning journey.

  • Fundamentals
  • Advanced
  • Expert

Faculty

You learn the work, not only the tool.

TTFA Academy brings practitioners from Fortune 500 companies, each with 10 to 12 years of experience. You learn the real challenges of the work from people who have met them, not only how to use the tools.

What that means in class

  • Project-based live training on weekends

    Live classes of 2.5 hours on Saturday and on Sunday, built around projects modelled on production work rather than on a toy example.

  • The weekly 1:1 review

    Once a week you go through your own work with a practitioner: what holds, what breaks, and what to change before the next class.

  • Feedback on the 7 assignments at each level

    Each assignment comes back with comments from someone who does this work, before the end-to-end live structured project of that level.
  • Production habits

    Naming, documenting, checking totals and handing work over, the way it is done on a team where other people rely on the number.

What a tool lesson teaches, and what a practitioner adds

  • A tool lesson teachesHow to write a join

    A practitioner addsWhy the totals change after a join, and how to check them

  • A tool lesson teachesHow to build a dashboard

    A practitioner addsWhat a manager asks in the first minute

  • A tool lesson teachesHow to automate a report

    A practitioner addsWhat to do on the morning the refresh fails

  • A tool lesson teachesHow to use an AI assistant

    A practitioner addsWhen not to trust it, and how to test it

How the weeks run

Built around a full-time job.

A counsellor confirms the exact days and times on the call.

  1. Saturday live class

    2.5 hours with the mentor, on the work of the week.

  2. Sunday live class

    2.5 hours more: 5 hours of live class a weekend, built around the project.

  3. Weekly 1:1 review

    A 1:1 review with a mentor every week; every class is recorded the same day.

  4. Assignments and the live project

    7 assignments and 1 end-to-end live structured project at each level, reviewed like production work.
Plans and prices

Subscription plans

Three plans for this track. Pick how you want to learn: at your own pace, live with career preparation, or with everything included.

This is the price of the track. The full Applied Data Analytics programme, with all 17 modules, is ₹19,999 / ₹39,999 / ₹59,999. See the full programme's plans

  • Launch price on Pro: ₹9,999
  • Every price includes GST
  • Instalments available: a counsellor confirms the options in writing
  • Premium

    Most chosen

    Live training and career preparation

    For learners who want live classes, mentor feedback and career preparation.

    List price ₹25,999

    Plan price ₹19,999

    Save ₹6,000

    incl. GST · instalments available

    • Live weekend classes with working professionals: 2.5 hours on Saturday and on Sunday
    • One batch (batch changes are not included)
    • All three levels: Fundamentals, Advanced and Expert
    • 7 assignments and 1 end-to-end live structured project at each level, with mentor feedbackIn this track: 84 assignments and 12 live projects, across its 4 tools.
    • A weekly 1:1 review
    • Real-world case studies
    • Resume preparation, mock interviews and career guidance
    • LMS access for 2 years

Questions about the plans

A counsellor answers anything else on a call. Nothing is charged on the call.

Questions

About this track.

Anything else: ask on the call.

The full Applied Data Analytics programme

It is part of it. Excel, SQL, Power BI and Python make up eight of the seventeen modules of Applied Data Analytics. The programme also teaches SharePoint, Alteryx, Tableau, descriptive statistics, visual science for data visualisation, Generative AI for Analysts and communication skills. There is one programme; this page shows the part these four tools cover.

Not sure where to start? Ask on the call.

A counsellor looks at what you do today and tells you, straight, whether Applied Data Analytics is the right next step.

See the full Applied Data Analytics programme